
Interactive Map Solutions: Transform Data Visualization for Organizations
Interactive map have revolutionized how organizations present complex geographical data, making information more accessible and engaging for users. These dynamic mapping solutions enable businesses, nonprofits, and government agencies to transform static data into compelling visual experiences that drive better decision-making.
Understanding Interactive Map Technology
An interactive map is a digital map that allows users to explore, engage, and interact with data rather than just viewing it passively. Unlike static maps, it lets users zoom, pan, filter, and click on locations to see detailed information, such as project status, resources, or real-time updates. Interactive maps are widely used in project management, business, healthcare, and NGOs because they make complex data visual, easy to understand, and actionable, helping organizations improve decision-making, transparency, and coordination.
Key features of modern interactive mapping include:
- Zoom & Pan – Users can explore areas in detail or view the bigger picture.
- Search & Filter – Find specific locations, projects, or data points quickly.
- Data Layers – Display multiple types of information (e.g., sites, resources, risks) on the same map.
- Real-Time Updates – Show live project progress, reports, or field data.
- Clickable Markers – Each location can show details like status, photos, or documents when clicked.
Real-World Impact: Community Seed Bank Nepal
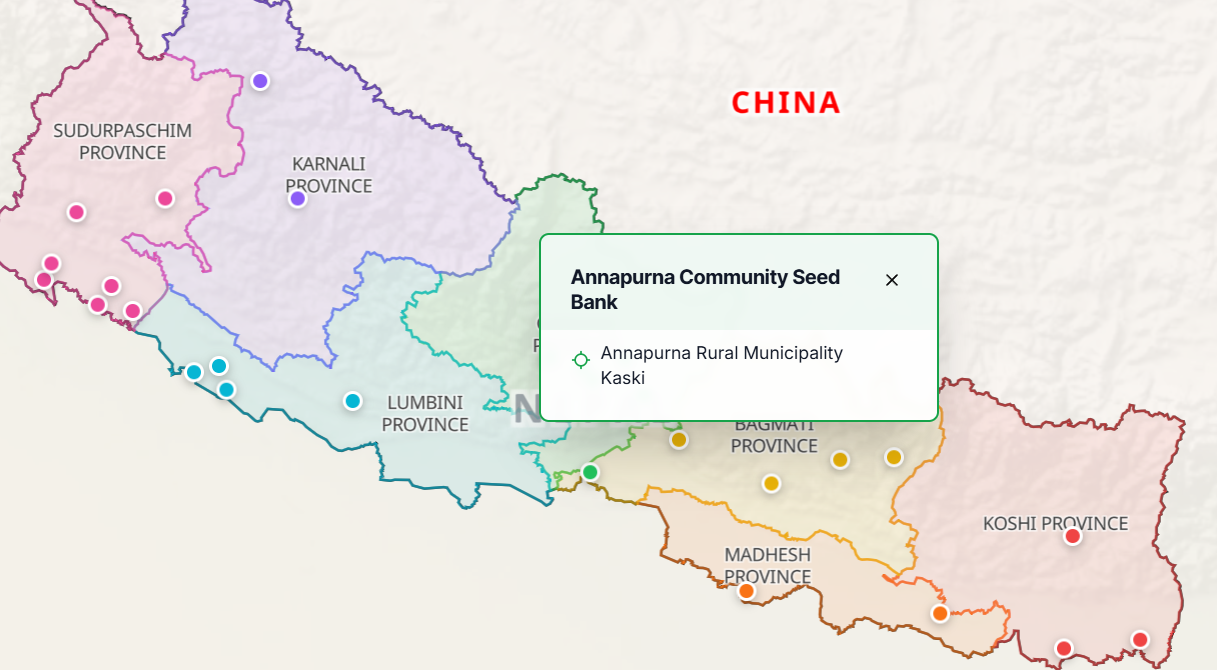
Cellapp showcases the power of interactive mapping through its Community Seed Bank Nepal project. This innovative platform demonstrates how organizations can harness mapping technology to drive social impact. The interactive map features seed banks across Nepal, organizing their locations and essential details for easy access. Farmers and communities can quickly locate seed banks, making vital agricultural resources more accessible. By centralizing this information, the platform creates a collaborative, comprehensive resource that empowers agricultural communities nationwide.
Organizational Benefits of Dynamic Map Implementation
Enhanced Data Accessibility
Interactive maps transform complex geographical data into intuitive visual insights. Organizations can present location-based information clearly, making it easier for diverse audiences to access, understand, and act on critical data.
Improved User Engagement
Dynamic mapping solutions drive user interaction up to 300% compared to static alternatives. Engaging interactive features encourage deeper exploration, keeping users invested in organizational data and insights.
Cost-Effective Data Management
Modern interactive map platforms streamline data collection and reduce administrative costs. Organizations can leverage community contributions while ensuring accuracy through verification systems, making data management efficient and scalable.
Optimized Project & Portfolio Management
Interactive maps simplify project oversight by visualizing sites, resources, and progress in a single, actionable tool. They enhance communication, improve resource allocation, and provide real-time updates, enabling smarter decisions, better coordination, and greater transparency.
Maximizing Impact Through Strategic Implementation
1. Define Clear Mapping Objectives
Before implementing an interactive map, organizations must establish precise goals. Whether it’s tracking resources, managing locations, or engaging communities, well-defined objectives ensure the map delivers maximum value and drives actionable insights.
2. Select the Right Technology Stack
Choose mapping platforms based on scalability, mobile compatibility, and integration capabilities. The solution should seamlessly align with existing infrastructure while supporting future growth and evolving organizational needs.
3. Prioritize User-Centric Design
The success of an interactive map depends on intuitive navigation and a clear visual hierarchy. Users should effortlessly explore map features, access relevant information, and engage meaningfully with the data.
Where Interactive Maps Can Make an Impact
Nonprofit Organizations
Nonprofits leverage interactive maps to visualize programs, engage donors, and showcase impact. By turning data into compelling geographic stories, these tools make mission outcomes clear and inspire greater support.
Healthcare Systems
Dynamic mapping helps healthcare providers optimize facility locations, visualize service areas, and plan resource allocation. Interactive features guide patients to the right care quickly, improving accessibility and efficiency.
Educational Institutions
Schools and universities use interactive maps for campus navigation, presenting research data, and driving community engagement. These tools make information more accessible and enhance the overall learning and outreach experience.
Future of Interactive Map Technology
Emerging technologies like artificial intelligence and machine learning are revolutionizing interactive maps. Organizations can leverage AI-driven predictive analytics, automated data processing, and personalized user experiences to gain deeper insights and make smarter decisions.
The integration of IoT sensors and real-time data streams is taking maps to the next level, enabling dynamic, up-to-the-minute visualization that enhances operational efficiency, strategic planning, and responsive decision-making.
Ultimately
Interactive maps represent a powerful tool for organizations seeking to improve data visualization and user engagement. The success of projects like Community Seed Bank Nepal demonstrates how thoughtful implementation of dynamic mapping solutions can create significant social and operational value.
Organizations ready to transform their data presentation should consider interactive mapping as an essential component of their digital strategy. The technology’s proven ability to enhance user experience while reducing operational complexity makes it an invaluable investment for forward-thinking organizations.


